


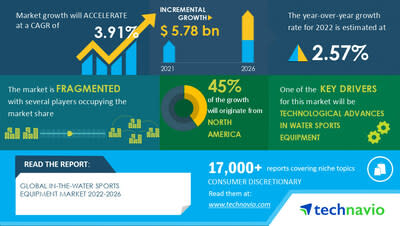
NEW YORK, Feb. 9, 2023 /PRNewswire/ — According to Technavio, the global in-the-water sports equipment market size is estimated to grow by USD 5.78 billion from 2021 to 2026. The market is estimated to grow at a CAGR of 3.91% during the forecast period. Moreover, the growth momentum will accelerate. North America will account for 45% of the market’s growth during the forecast period. The report provides a comprehensive analysis of growth opportunities at regional levels, new product launches, the latest trends, and the post-pandemic recovery of the global market. For more insights on market size, request a sample report
In-the-water sports equipment market – Five forces
The global in-the-water sports equipment market is fragmented, and the five forces analysis covers–
-
Bargaining power of buyers
-
The threat of new entrants
-
Threat of rivalry
-
Bargaining power of suppliers
-
Threat of substitutes
-
For an interpretation of Porter’s five forces model – Buy the report!
In-the-water sports equipment market – Customer landscape
The report includes the market’s adoption lifecycle, from the innovator’s stage to the laggard’s stage. It focuses on adoption rates in different regions based on penetration. Furthermore, the report also includes key purchase criteria and drivers of price sensitivity to help companies evaluate and develop their growth strategies.
In-the-water sports equipment market – Segmentation assessment
Segment overview
Technavio has segmented the market based on product (sports gear and sports apparel), type (swimming, water aerobics, and water polo), and distribution channel (offline and online).
-
The sports gear segment will account for a significant share of the market’s growth during the forecast period. The growth of this segment is attributed to factors such as the rising popularity of different types of water sporting activities and the reopening of water sports events, clubs, and amusement parks after the COVID-19 pandemic.
Geography overview
Based on geography, the global in-the-water sports equipment market is segmented into North America, Europe, APAC, South America, and Middle East and Africa. The report provides actionable insights and estimates the contribution of all regions to the growth of the global in-the-water sports equipment market.
-
North America will account for 45% of the market’s growth during the forecast period. The US and Canada are the key countries for the in-the-water sports equipment market in the region. Moreover, market growth in North America will be faster than the growth of the market in Europe, APAC, and MEA. Factors such as promotional campaigns and initiatives and a high participation rate in water sports will drive the in-the-water sports equipment market growth in North America during the forecast period.
In-the-water sports equipment market – Market dynamics
Key factor driving market growth
-
Technological advances in water sports equipment are driving the market growth.
-
The key competitors are innovating their products in terms of design, color, shape, and weight to meet the needs of consumers.
-
Many water sports equipment manufacturers are offering lightweight and advanced equipment.
-
In addition, the rising awareness about the benefits of leading a healthy lifestyle will further propel the demand for in-water sports equipment.
-
These factors will fuel the growth of the global market during the forecast period.
Leading trends influencing the market
-
The high popularity of in-water sports equipment is one of the key trends in the market.
-
In-water sports, especially swimming and water polo, have become popular sports at the Olympic Games.
-
In addition, the gender gap between the number of male and female athletes has been decreasing, thereby driving the popularity of swimming.
-
Many initiatives are being undertaken to promote the growth and expansion of water sports facilities.
-
Such factors will further support the market growth.
Major challenges hindering market growth
-
Strict regulations on high-tech swimsuits will challenge the in-the-water sports equipment market growth during the forecast period.
-
High-tech swimsuits are made up of scientifically advanced fabrics and materials such as nylon composites and spandex.
-
However, FINA has banned the use of these swimsuits due to the use of high-technology swimwear fabric in swimming competitions.
-
According to FINA guidelines set in 2015, swimsuits should be permeable to water and should not contain any metal, rubber, or polyurethane. It has also set certain coverage requirements.
-
Such regulations are hampering the growth of the global in-water sports equipment market.
What are the key data covered in this in-the-water sports equipment market report?
-
CAGR of the market during the forecast period
-
Detailed information on factors that will drive the growth of the in-the-water sports equipment market between 2022 and 2026
-
Precise estimation of the size of the in-the-water sports equipment market and its contribution to the parent market
-
Accurate predictions about upcoming trends and changes in consumer behavior
-
Growth of the in-the-water sports equipment market across North America, Europe, APAC, South America, and Middle East and Africa
-
A thorough analysis of the market’s competitive landscape and detailed information about vendors
-
Comprehensive analysis of factors that will challenge the growth of in-the-water sports equipment market vendors
Gain instant access to 17,000+ market research reports.
Technavio’s SUBSCRIPTION platform
Related Reports:
The surface water sports equipment market size is expected to increase by USD 11,211.88 million from 2021 to 2026, and the market’s growth momentum will accelerate at a CAGR of 7.31%. This report extensively covers segmentation by product (apparel and others), type (surfing, boarding, sailing, skiing, and others), and geography (North America, Europe, APAC, South America, and Middle East and Africa).
The water scooter market size is expected to increase by USD 920.82 million from 2021 to 2026, and the market’s growth momentum will accelerate at a CAGR of 9.04%. This report extensively covers segmentation by type (above water and underwater), propulsion (fuel-operated and battery-operated), application (commercial, military, and personal), and geography (North America, Europe, APAC, the Middle East and Africa, and South America).
|
In-the-Water Sports Equipment Market Scope |
|
|
Report Coverage |
Details |
|
Page number |
120 |
|
Base year |
2021 |
|
Forecast period |
2022-2026 |
|
Growth momentum & CAGR |
Accelerate at a CAGR of 3.91% |
|
Market growth 2022-2026 |
USD 5.78 billion |
|
Market structure |
Fragmented |
|
YoY growth 2021-2022 (%) |
2.57 |
|
Regional analysis |
North America, Europe, APAC, South America, and Middle East and Africa |
|
Performing market contribution |
North America at 45% |
|
Key countries |
US, Canada, China, UK, and France |
|
Competitive landscape |
Leading vendors, market positioning of vendors, competitive strategies, and industry risks |
|
Key companies profiled |
adidas AG, Aqua Lung International, Arena Spa, BEUCHAT INTERNATIONAL S.A.S, Boardriders Inc., Apollo Sports USA, Billabong, Cressi Sub Spa, Johnson Outdoors Inc., KAP7 International, Mares Spa, Mikasa Corp., Nike Inc., Obrien, Pentland Brands Ltd., Speedo International Ltd, Turbo Swim, and Under Armour Inc. |
|
Market dynamics |
Parent market analysis, market growth inducers and obstacles, fast-growing and slow-growing segment analysis, COVID-19 impact and recovery analysis and future consumer dynamics, and market condition analysis for the forecast period. |
|
Customization purview |
If our report has not included the data that you are looking for, you can reach out to our analysts and get segments customized. |
Browse for Technavio’s consumer discretionary market reports
Table of contents
1. Executive Summary
1.1 Market overview
Exhibit 01: Executive Summary – Chart on Market Overview
Exhibit 02: Executive Summary – Data Table on Market Overview
Exhibit 03: Executive Summary – Chart on Global Market Characteristics
Exhibit 04: Executive Summary – Chart on Market by Geography
Exhibit 05: Executive Summary – Chart on Market Segmentation by End-user
Exhibit 06: Executive Summary – Chart on Incremental Growth
Exhibit 07: Executive Summary – Data Table on Incremental Growth
Exhibit 08: Executive Summary – Chart on Vendor Market Positioning
2. Market Landscape
2.1 Market ecosystem
Exhibit 09: Parent market
Exhibit 10: Market Characteristics
3. Market Sizing
3.1 Market definition
Exhibit 11: Offerings of vendors included in the market definition
3.2 Market segment analysis
Exhibit 12: Market segments
3.3 Market size 2021
3.4 Market outlook: Forecast for 2021-2026
Exhibit 15: Chart on Global – Market size and forecast 2021-2026 ($ million)
Exhibit 16: Data Table on Global – Market size and forecast 2021-2026 ($ million)
Exhibit 17: Chart on Global Market: Year-over-year growth 2021-2026 (%)
Exhibit 18: Data Table on Global Market: Year-over-year growth 2021-2026 (%)
4. Five Forces Analysis
4.1 Five Forces Summary
Exhibit 17: Five forces analysis – Comparison between2021 and 2026
4.2 Bargaining power of buyers
Exhibit 18: Chart on Bargaining power of buyers – Impact of key factors 2021 and 2026
4.3 Bargaining power of suppliers
Exhibit 19: Bargaining power of suppliers – Impact of key factors in 2021 and 2026
4.4 Threat of new entrants
Exhibit 20: Threat of new entrants – Impact of key factors in 2021 and 2026
4.5 Threat of substitutes
Exhibit 21: Threat of substitutes – Impact of key factors in 2021 and 2026
4.6 Threat of rivalry
Exhibit 22: Threat of rivalry – Impact of key factors in 2021 and 2026
4.7 Market condition
Exhibit 25: Chart on Market condition – Five forces 2021 and 2026
5 Market Segmentation by Distribution Channel
5.1 Market segments
The segments covered in this chapter are Offline and Online.
Exhibit 26: Chart on Distribution Channel – Market share 2021-2026 (%)
Exhibit 27: Data Table on Distribution Channel – Market share 2021-2026 (%)
5.2 Comparison by Distribution Channel
Exhibit 28: Chart on Comparison by Distribution Channel
Exhibit 29: Data Table on Comparison by Distribution Channel
5.3 Offline – Market size and forecast 2021-2026
Exhibit 30: Chart on Offline – Market size and forecast 2021-2026 ($ million)
Exhibit 31: Data Table on Offline – Market size and forecast 2021-2026 ($ million)
Exhibit 32: Chart on Offline – Year-over-year growth 2021-2026 (%)
Exhibit 33: Data Table on Offline – Year-over-year growth 2021-2026 (%)
5.4 Online – Market size and forecast 2021-2026
Exhibit 34: Chart on Online – Market size and forecast 2021-2026 ($ million)
Exhibit 35: Data Table on Online – Market size and forecast 2021-2026 ($ million)
Exhibit 36: Chart on Online – Year-over-year growth 2021-2026 (%)
Exhibit 37: Data Table on Online – Year-over-year growth 2021-2026 (%)
5.5 Market opportunity by Distribution Channel
Exhibit 38: Market opportunity by Distribution Channel ($ million)
6 Market Segmentation by Product
6.1 Market segments
The segments covered in this chapter are Sports gear and Sports apparel.
Exhibit 39: Chart on Product – Market share 2021-2026 (%)
6.2 Comparison by Product
Exhibit 40: Chart on Comparison by Product
Exhibit 41: Data Table on Comparison by Product
6.3 Sports gear – Market size and forecast 2021-2026
Exhibit 42: Chart on Sports gear – Market size and forecast 2021-2026 ($ million)
Exhibit 43: Data Table on Sports gear – Market size and forecast 2021-2026 ($ million)
Exhibit 44: Chart on Sports gear – Year-over-year growth 2021-2026 (%)
Exhibit 45: Data Table on Sports gear – Year-over-year growth 2021-2026 (%)
6.4 Sports apparel – Market size and forecast 2021-2026
Exhibit 46: Chart on Sports apparel – Market size and forecast 2021-2026 ($ million)
Exhibit 47: Data Table on Sports apparel – Market size and forecast 2021-2026 ($ million)
Exhibit 48: Chart on Sports apparel – Year-over-year growth 2021-2026 (%)
Exhibit 49: Data Table on Sports apparel – Year-over-year growth 2021-2026 (%)
6.5 Market opportunity by Product
Exhibit 50: Market opportunity by Product ($ million)
7 Market Segmentation by Type
7.1 Market segments
The segments covered in this chapter are Swimming, Water aerobics, and Water polo.
Exhibit 51: Chart on Type – Market share 2021-2026 (%)
Exhibit 52: Data Table on Type – Market share 2021-2026 (%)
7.2 Comparison by Type
Exhibit 53: Chart on Comparison by Type
Exhibit 54: Data Table on Comparison by Type
7.3 Swimming – Market size and forecast 2021-2026
Exhibit 55: Chart on Swimming – Market size and forecast 2021-2026 ($ million)
Exhibit 56: Data Table on Swimming – Market size and forecast 2021-2026 ($ million)
Exhibit 57: Chart on Swimming – Year-over-year growth 2021-2026 (%)
Exhibit 58: Data Table on Swimming – Year-over-year growth 2021-2026 (%)
7.4 Water aerobics – Market size and forecast 2021-2026
Exhibit 59: Chart on Water aerobics – Market size and forecast 2021-2026 ($ million)
Exhibit 60: Data Table on Water aerobics – Market size and forecast 2021-2026 ($ million)
Exhibit 61: Chart on Water aerobics – Year-over-year growth 2021-2026 (%)
Exhibit 62: Data Table on Water aerobics – Year-over-year growth 2021-2026 (%)
7.5 Water polo – Market size and forecast 2021-2026
Exhibit 63: Chart on Water polo – Market size and forecast 2021-2026 ($ million)
Exhibit 64: Data Table on Water polo – Market size and forecast 2021-2026 ($ million)
Exhibit 65: Chart on Water polo – Year-over-year growth 2021-2026 (%)
Exhibit 66: Data Table on Water polo – Year-over-year growth 2021-2026 (%)
7.6 Market opportunity by Type
Exhibit 67: Market opportunity by Type ($ million)
6. Customer landscape
Technavio’s customer landscape matrix comparing Drivers or price sensitivity, Adoption lifecycle, importance in customer price basket, Adoption rate and Key purchase criteria
6.1 Customer landscape overview
Exhibit 68: Analysis of price sensitivity, lifecycle, customer purchase basket, adoption rates, and purchase criteria
7 Geographic Landscape
9.3 North America – Market size and forecast 2021-2026
Exhibit 69: Chart on North America – Market size and forecast 2021-2026 ($ million)
Exhibit 70: Data Table on North America – Market size and forecast 2021-2026 ($ million)
Exhibit 71: Chart on North America – Year-over-year growth 2021-2026 (%)
Exhibit 72: Data Table on North America – Year-over-year growth 2021-2026 (%)
9.4 Europe – Market size and forecast 2021-2026
Exhibit 73: Chart on Europe – Market size and forecast 2021-2026 ($ million)
Exhibit 74: Data Table on Europe – Market size and forecast 2021-2026 ($ million)
Exhibit 75: Chart on Europe – Year-over-year growth 2021-2026 (%)
Exhibit 76: Data Table on Europe – Year-over-year growth 2021-2026 (%)
9.5 APAC – Market size and forecast 2021-2026
Exhibit 77: Chart on APAC – Market size and forecast 2021-2026 ($ million)
Exhibit 78: Data Table on APAC – Market size and forecast 2021-2026 ($ million)
Exhibit 79: Chart on APAC – Year-over-year growth 2021-2026 (%)
Exhibit 80: Data Table on APAC – Year-over-year growth 2021-2026 (%)
9.6 South America – Market size and forecast 2021-2026
Exhibit 81: Chart on South America – Market size and forecast 2021-2026 ($ million)
Exhibit 82: Chart on South America – Year-over-year growth 2021-2026 (%)
Exhibit 83: Data Table on South America – Year-over-year growth 2021-2026 (%)
9.7 Middle East and Africa – Market size and forecast 2021-2026
Exhibit 84: Chart on Middle East and Africa – Market size and forecast 2021-2026 ($ million)
Exhibit 85: Data Table on Middle East and Africa – Market size and forecast 2021-2026 ($ million)
Exhibit 86: Chart on Middle East and Africa – Year-over-year growth 2021-2026 (%)
Exhibit 87: Data Table on Middle East and Africa – Year-over-year growth 2021-2026 (%)
9.8 US – Market size and forecast 2021-2026
Exhibit 88: Chart on US – Market size and forecast 2021-2026 ($ million)
Exhibit 89: Data Table on US – Market size and forecast 2021-2026 ($ million)
Exhibit 90: Chart on US – Year-over-year growth 2021-2026 (%)
Exhibit 91: Data Table on US – Year-over-year growth 2021-2026 (%)
9.9 France – Market size and forecast 2021-2026
Exhibit 92: Chart on France – Market size and forecast 2021-2026 ($ million)
Exhibit 93: Data Table on France – Market size and forecast 2021-2026 ($ million)
Exhibit 94: Chart on France – Year-over-year growth 2021-2026 (%)
Exhibit 95: Data Table on France – Year-over-year growth 2021-2026 (%)
9.10 China – Market size and forecast 2021-2026
Exhibit 96: Chart on China – Market size and forecast 2021-2026 ($ million)
Exhibit 97: Data Table on China – Market size and forecast 2021-2026 ($ million)
Exhibit 98: Chart on China – Year-over-year growth 2021-2026 (%)
Exhibit 99: Data Table on China – Year-over-year growth 2021-2026 (%)
9.11 Canada – Market size and forecast 2021-2026
Exhibit 100: Chart on Canada – Market size and forecast 2021-2026 ($ million)
Exhibit 101: Data Table on Canada – Market size and forecast 2021-2026 ($ million)
Exhibit 102: Chart on Canada – Year-over-year growth 2021-2026 (%)
Exhibit 103: Data Table on Canada – Year-over-year growth 2021-2026 (%)
9.12 Market opportunity by geography
Exhibit 104: Market opportunity by geography ($ million)
8. Drivers, Challenges, and Trends
8.1 Market drivers
10.1.1 Technological advances in water sports equipment
10.1.2 Increasing interest and participation in water sports
10.1.3 Growing consumer preference for fitness
8.2 Market challenges
10.2.1 Strict regulations on high tech swimsuits
10.2.2 Religious restrictions on swimwear
10.2.3 Lack of sponsorships and mass media appeal
8.3 Impact of drivers and challenges
Exhibit 105: Impact of drivers and challenges in 2021 and 2026
8.4 Market trends
10.4.1 Greater popularity of in water sports
10.4.2 Increase in the number of female participation in water sports
10.4.3 Growing number of water pools worldwide
9. Vendor Landscape
9.1 Overview
9.2 Vendor landscape
Exhibit 106: Overview on Criticality of inputs and Factors of differentiation
9.3 Landscape disruption
Exhibit 107: Overview on factors of disruption
9.4 Industry risks
Exhibit 108: Impact of key risks on business
10. Vendor Analysis
10.1 Vendors covered
Exhibit 109: Vendors covered
10.2 Market positioning of vendors
Exhibit 110: Matrix on vendor position and classification
12.3 adidas AG
Exhibit 111: adidas AG – Overview
Exhibit 112: adidas AG – Business segments
Exhibit 113: adidas AG – Key new
About Us
Technavio is a leading global technology research and advisory company. Their research and analysis focus on emerging market trends and provide actionable insights to help businesses identify market opportunities and develop effective strategies to optimize their market positions. With over 500 specialized analysts, Technavio’s report library consists of more than 17,000 reports and counting, covering 800 technologies, spanning across 50 countries. Their client base consists of enterprises of all sizes, including more than 100 Fortune 500 companies. This growing client base relies on Technavio’s comprehensive coverage, extensive research, and actionable market insights to identify opportunities in existing and potential markets and assess their competitive positions within changing market scenarios.
Contact
Technavio Research
Jesse Maida
Media & Marketing Executive
US: +1 844 364 1100
UK: +44 203 893 3200
Email: [email protected]
Website: www.technavio.com/


View original content to download multimedia:https://www.prnewswire.com/news-releases/in-the-water-sports-equipment-market-size-is-expected-to-grow-by-usd-5-78-billion-from-2021-to-2026-a-descriptive-analysis-of-five-forces-model-market-dynamics-and-segmentation—technavio-301740598.html
SOURCE Technavio


